


2021 NHL Draft - WHL Prospect Evaluation/Ranking Through Analytics
Comparing Rankings From Basic Analytics Model with NHL Final Rankings

Welcome back!
All data is thanks to the analytics and video platform of InStat Hockey.
Introduction
I was reviewing the NHL’s 2021 list of final draft rankings, looking specifically at the WHL players and their position on that draft list. Not surprisingly, I was somewhat “surprised” by the rank order of WHL players on that list based on both my “eye test” as well as some of the basic analytics I was following during play in each of the WHL bubbles. I believe there are several WHL “diamonds in the rough” that, based the NHL’s final ranking list have “flown under the radar”. Now, this does not necessarily mean that these players aren’t being ranked accordingly by each individual NHL team (and I fully expect that this is the case) but I thought it would be fun to run a basic analytics draft model/ranking and compare it to the NHL’s draft rankings for WHL players.
My model is by no means the “right” answer, but I am happy with the models results/rankings and how they matched my “eye test” of these players as I watched all of the games in each of the WHL bubbles.
Analytics Model
There are approximately 42 players from the WHL on the NHL’s final draft ranking list. Two of these players (Carson Lambos and Cole Sillinger) played in Europe and the USHL respectively this past year while pretty much the rest of the players played in the WHL bubbles. Some of the WHL players also played in the IIHF U18 Championships and I have included those games for those players. Therefore, for the most part I am comparing apples to apples. Based on different levels of competition, Lamsos and Sillingers’ numbers may be difficult to compare to their peers. Also, the level of competition was “locked-in” in each bubble and therefore comparing player’s analytics numbers between the bubbles may be difficult.
All analytics metrics were measured even strength and normalized to averages for 60 min TOI where necessary.
So what should go into a basic analytics model to assess players? Well, if I had that answer I wouldn’t be writing this blog for fun, I’d be getting paid at some higher level.
Basically, we would like to look at the general offensive and defensive contributions of a player. Further, we would like look at which offensive players are “finishers” and which are “playmakers”. Then we would like to assess the “compete” level of players. Finally, we need to look at the all important area of “transitions” and how players are contributing to entries and exits.
For my analytics model I used several metrics that I felt represented the components discussed above in assessment of players. I believe the metrics I have measured encapsulate what a “good” player should be and many of these metrics are important for translatable skills to the next level.
InStat Index
In my last article I introduced the concept of the InStat Index Metric. The InStat Index is an automatic algorithm that assesses every player taking into account the player’s actions, game situation, skater’s time on ice and impact on the team. The InStat Index determines the team’s and player’s rating amongst his peers. It singles out leaders of the team based not only on their scoring history but also on their workload and team play.
The InStat Index algorithm tracks events during the team’s puck possession. 10 key parameters are measured with 7 positive outcomes of the possession and 3 negative outcomes of the possession being tracked. These 10 criteria help to evaluate what is the maximum result achieved in the possession.
The 10 key parameters that are measured include:
Goal. Maximum positive result
Powerplay earned
Shot on goal from high-scoring zone
Shot on goal from low-scoring zone
Face-off earned in the offensive zone
Entry into the offensive zone
Breakout from the defensive zone
Puck loss in the defensive zone
Face-off earned in the defensive zone
Goal against. Maximum negative result.
Each of the 10 key parameters has a weighting coefficient attached to it. Points for each possession are summed into InStat Index for the game.
One more variable influencing final result is time on ice. Player who got more than 20 minutes for the game will have his sum multiplied by 1.045. If he spends little time – less than 10 minutes – his InStat Index will be decreased as the sum of his points will be multiplied by 0.955.
Net Expected Goals For (Net xGF)
For this metric I wanted to assess a players “finish” by comparing the actual number of goals he scored compared to the expected goals (xGF) that models predicted that he should have scored based on unblocked shot attempts the player has made. If this Net xGF number is positive the player has scored more goals than the xG model predicted and he must have good “finish”. If the number is negative, then the player must be unlucky, have poor finish or faced a hot goaltender. However, over a larger number of games the hot goaltender theory is less likely.
Corsi For % - Corsi Against %
While a player is on the ice, I wanted to get an understanding of his offensive and defensive contributions and assess whether there was more offense happening for his team versus offense for the opponents team. Generally speaking, a Corsi For % greater than 50% is good and a Corsi Against % less than 50% is good.
Passes To The Slot
This metric was used to measure a players “playmaking” ability. Passes to the slot are passes that usually result in a high danger scoring chance. Players that make these passes are very good playmakers recognizing where the dangerous high quality scoring chance areas are on the OZ ice.
Puck Battle Win %
To assess the “compete” level of a player I measured their successful puck battle % all over the ice (OZ,NZ,DZ). Players with a high puck battle % , in my opinion, have a high compete level.
Zone Entries and Zone Exits
With these to metrics I am measuring the players effectiveness in “transition” play. Players that generate more controlled entries and exits per 60 min TOI excel at the transition game and puck possession game.
Tabulation of Rankings
For each of the above metrics, I ranked the players 1-42. If a player was best in a metric category he was awarded a score of 42. If he was the worst in a metric category he was awarded a score of 1.
The score for each of the seven metrics was totalled for each of the players. A perfect score would have been (42*7) = 294. The worst score would have been (7*1) = 7.
Based on the total score for each player I ranked each of the WHL players from 1-42 based on my analytics model. I then compared it to the final draft raking created by NHL scouting staff.
Results
The analytics model table is quite large so the following link is a view-only access to the table for review of those interested Analytics Model Table. This table will allow you to look at each individual metric and how players ranked for each metric!
The table below lists the player, my model ranking, the NHL ranking (order of WHL players on NHL list) and the absolute position on the NHL list.
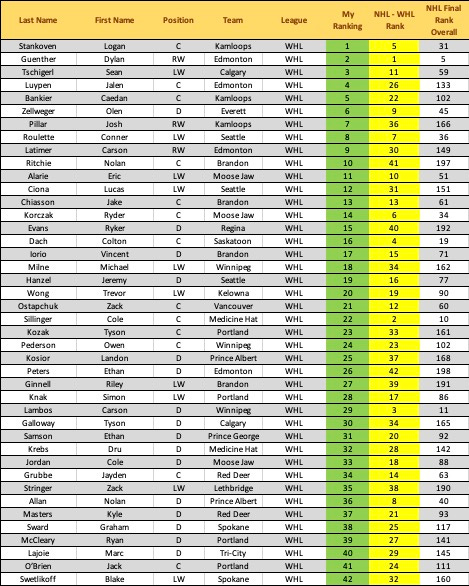
There are several players where my model rankings were fairly close (+/- 5 or 6) to the NHL rankings. Stankoven, Guenther, Zellweger, Roulette, Alarie, Chiasson, Iorio, Hanzel, Wong, Pederson, Galloway, Krebs, and Stringer as examples.
I wanted to examine discrepancies in closer detail
Starting with the C’s, notable model discrepancies at the C position included: Luypen (4 mine - 26 NHL), Bankier (5 mine - 22 NHL), Ritchie (10 mine - 41 NHL), Korczak (14 mine - 6 NHL) and Dach (16 mine - 4 NHL), Ostapchuk (21 mine - 12 NHL, Sillinger (22 mine - 2 NHL), Kozak (23 mine - 33 NHL), Grubbe (34 mine - 14 NHL), and O’Brien (41 mine - 24 NHL).
In terms of offensive and defensive contributions: Stankoven, Luypen, Korczak, Bankier, Ostapchuk, Kozak, Pederson, and Ritchie have CF% above 55% (excellent) and CA% below 45% (excellent). Dach, Chiasson, O’Brien, Grubbe, and Sillinger rounded out the order of CF% and CA% (below average for a F).
Korczak, Ostapchuk, Kozak, Pederson, Grubbe and O’Brien all have Net xGF that was negative. That means the goals they scored were less than those expected based on xG model. As an individual metric, this means that these players were less skilled at being “finishers” which as a C position and a F is a key element.
Stankoven, Kozak, Bankier, Ritchie, Pederson, Grubbe, Korczak had good passes to the slot “playmakers”. Chiasson, O’Brien, Sillinger, Dach, Ostapchuk, and Luypen were below average in this category.
Stankoven, Ritchie, Luypen, Kozak and Korczak all had board battle % above 50% while the other C’s were below 50%. Dach, Chiasson, O’Brien, Grubbe, and Sillinger had “compete” levels less than 50%.
Based on the above, I’m pretty happy with how my model ranks the C’s.
Next looking at the RW’s: Guenther is a player where my model is close to NHL rankings. Pillar (mine 7 - NHL 36) and Latimer (mine 9 - NHL 30) show large discrepancies between my model and the NHL ranking.
Pillar’s and Latimer’s InStat Index is within the top 10 of all F’s. Both have negative Net xGF numbers which points out they may not be the best “finishers”.
However, both Pillar and Latimer have the top 3 CF % CA% of all the WHL players meaning they are top end in terms of offensive and defensive production. Latimer and Pillar are in the middle of the pack when looking at passes to the slot “playmakers”. Latimer and Pillar are below average in their board battle % win or “compete” level. Pillar has the best zone entry rank while Latimer is top 11. Pillar is top 10 in zone exit rank and Latimer is top 23. Both these players, particularly Pillar are very good at the “transition” game.
Next looking at LW’s: Roulette, Alarie, Stringer and Wong have good concordance between my model and the NHL rankings. Discrepancies include: Tschigerl (mine 3 - 11 NHL); Ciona (mine 12 - 31 NHL); Ginnell (mine 27 - NHL 39); Knak (mine 28 - 17 NHL); Swetlikoff (mine 42 - NHL 32); and Milne (mine 18 - NHL 34).
Tschigerl, Knak and Milne lead the way for left wingers in the InStat index. Tschigerl has the best Net xGF for LW’s suggesting he is a good “finisher” while CIona, Ginnell, Knak, Swetliokoff and Milne all have negative Net xGF suggesting they are poor “finishers”. Ciona and Swetlikoff have below average CF% and above average CA% suggestive that they are not very good at offensive and defensive contributions. Roulette, Ciona, Milne and Wong have above average passes to the slot suggesting they are good “playmakers” while other LW are average or below average. Ciona, Swetlikoff and Wong are above average in their “compete” level. Tschigerl, Roulette and Ginnell were above average in Zone entries while Tschigerl and Roulette were above average in zone exits. Tschigerl and Roulette appear to be good in the “transition” game.
On the D side of things, major discrepancies were noted with Ryker Evans (15 mine - 40 NHL) and Carson Lambos (29 mine - 3 NHL). Evans and Lambos have similar metrics with Lambos having a slightly better board battle % but Evans having much better “transition” metrics. However, this may be due to Lambos playing more difficult competition.
Conclusion
Based on my simple analytics model, I believe Tschigerl, Luypen, Bankier, Pillar, Latimer, Ritchie and Ciona are all forwards that are undervalued in the NHL draft rank list while Dach and Sillinger are over valued in the NHL draft rank list.
Evans, Kosior, Peters are undervalued in the NHL draft rank list while Lambos, Allan are significantly overvalued and Samson, Jordan, Masters, Sward, McCleary and Lajoie are moderately overvalued.
The 2021 NHL Entry Draft will be held July 23-24. I look forward to seeing where individual NHL teams draft WHL players and will do a follow-up article comparing final WHL draft rankings to my model and the NHL’s final draft rankings.